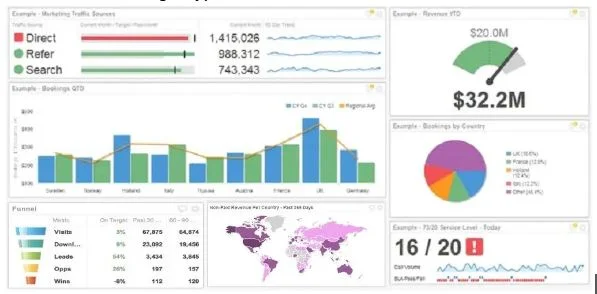
Current Reports & Dashboards
- × You have to remember to check, on every metric, every week.
- × A trend can break weeks before anyone notices the line moved.
- × The “why” behind a number lives in a different tool, or a person’s head.
Provento connects your financial and operational data, alerts you to risks and opportunities as they emerge, and explains the drivers in Slack, Teams, or other platforms—so your team can act before the next reporting cycle.
✓ Live in under 30 min inside your Slack, Teams, or other system of record.*
A CFO's planning channel, where Provento posts alerts from most to least important.
Your data may already show a revenue gap, rising costs, or a margin risk. But if no one spots and explains the change until the next review, you lose time to respond.
Proactive and explainable — it comes to the right person the day it moves.
Forecast risk alert: At the current run rate, Q4 operating expense is projected to exceed plan by $1.6M. Engineering contractors account for $900K of the change.
Workforce cost drift alert: Planned hiring and local salary rates put next quarter’s people costs 7% above plan, concentrated in two delivery locations.
Revenue or pipeline shortfall alert: Enterprise pipeline coverage fell from 3.4× to 2.6× after two large deals slipped; the current-quarter revenue target is now at risk.
Margin erosion alert: Delivery costs are rising faster than revenue on three accounts; projected gross margin has fallen below the agreed floor.
Capacity mismatch alert: Committed work next month exceeds available capacity in a critical skill group, while another location has capacity.
Cash or collections risk alert: Several large invoices are overdue and expected receipts have slipped, putting the cash forecast below its minimum buffer.
Material upside alert: Higher utilization and lower-than-planned contractor spend could improve quarter-end margin if sustained.
Data or assumption failure alert: The headcount forecast is using an outdated labor-rate table; its projected cost is no longer reliable.
Provento connects financial and operational data to help your team spot changes, understand the drivers, and respond before the next reporting cycle.
See emerging revenue gaps, rising costs, and margin pressure—or unexpected upside—without waiting for someone to open a dashboard.
Get the context behind a variance: which teams, accounts, locations, or business assumptions are contributing—and where to investigate.
Explore how changes to hiring, spending, or delivery plans could affect costs, capacity, and margins.
Receive relevant signals and supporting context in Slack or Teams, so the right people can review the issue and coordinate a response.
Connect changes in business performance to your financial outlook, so your team can assess whether the plan still holds.
Provento brings financial and operational data together, identifies meaningful changes, and delivers the context your team needs to respond.
Bring together data from your finance, HR, sales, and operational systems—without asking your team to replace its existing tools.
Define the targets and trends that matter. Provento monitors for meaningful changes and highlights the drivers behind them.
Receive relevant alerts in Slack or Teams, with supporting evidence and the potential business impact—so the right people can investigate and respond.
From proactive alerts to follow-up questions, see how Provento brings financial and operational context into your team’s workflow.
Illustrative examples. Names and figures are fictional. Available capabilities depend on connected data and configuration.
Operating expense is tracking above the Q4 plan.
Engineering contractor spend is $1.2M against an $800K budget—a $400K variance.
Review the spending breakdown to see which teams and contracts are contributing.
See the variance and its contributors without waiting for the monthly reporting cycle.
Q1 pipeline coverage has fallen from 3.4× to 2.6×.
Two Enterprise deals moved out of the quarter, reducing the pipeline available to support the revenue target.
Review the slipped deals and remaining coverage to assess whether the forecast needs updating.
Connect a pipeline change to the revenue plan—and see where to investigate.
“What’s driving the increase in next quarter’s people costs?”
The current plan includes approximately $900K in additional costs from the merit cycle and $600K in net additional costs from contractor-to-employee conversions.
View the breakdown by department and location, alongside the assumptions behind each change.
Source links: Compensation plan · Hiring plan · Conversion assumptions
Get the drivers behind the number, with supporting data and assumptions.
“What happens to next quarter’s people costs if we delay the planned hires by one month?”
Compare the current hiring plan with a one-month delay to estimate the change in next quarter’s people costs.
Review the affected roles, start dates, and cost assumptions before updating the plan.
Understand the financial trade-off before changing the plan.
“We had a positive experience evaluating Provento at Datamotive. The platform was easy to use and we particularly found the Teams integration and document-based Q&A capabilities useful for quickly accessing and working with information.”
“The ability to interact with documents through natural language questions made it easier to find relevant information without having to manually go through lengthy documents. We also appreciated the overall simplicity and usability of the platform.”
Datamotive
Platform evaluation team
Explore how Provento identifies changes, explains the drivers, and brings relevant signals into your workflow. We’ll walk through sample data and discuss your team’s priorities.
Book a DemoAsk a questioncontact@provento.ai · app.provento.aiDashboards and reports are still the right tool for reviewing performance on demand. Provento works alongside them: it identifies a meaningful change, adds the context needed to understand it, and delivers that signal into your team’s workflow, so people can act without first searching for it.
Examples include spending above plan, declining pipeline coverage, and changes in workforce costs. Observed variances are changes already present in your data, such as spending that is above plan today. Projected risks are forecasts that a metric will move off plan if current trends continue, and they are labeled as projections.
Provento compares each metric against the targets you set, the plan, and its recent trend, and alerts only when a change is meaningful. Thresholds and configuration options are set per metric during setup. How repeated and lower-priority notifications are handled is also configured and confirmed with your team before rollout.
Yes. Users can inspect the source records behind a signal, the drivers that contributed to it, and the forecast assumptions used. Forecasts carry uncertainty, so a projected risk is presented as a likely outcome, not a certain one.
Provento connects natively to PostgreSQL, Databricks, DocuSign, Slack, and Microsoft Teams. Systems without a connector can be added through flat-file uploads (CSV or Excel) or custom connections via direct database or API access. Forecasts draw on your last four quarters of history.
Setup requires read access to at least one data source, configuration of the metrics and plan targets to monitor, and a team member who can confirm them. Connecting a source can take under 30 minutes. Validating that a signal is useful takes longer, since your team checks that flagged changes match what they already know. A broader rollout across functions typically runs a few weeks.
Access is read-only, scoped to the data needed, and revocable at any time, with permissions managed by your team. Data is stored in a logically isolated environment, encrypted in transit and at rest. Retention and scope are documented before any data moves. Customer data is never sold or used to train models for other customers, and model-provider access is detailed in our security documentation.
Yes. The 30-minute walkthrough uses sample data to show what Provento detects, how it explains the drivers, and how alerts are delivered. A subsequent evaluation on your own data connects a source, reviews the signals it produces with your team, and confirms whether they are useful.